Graphs may be customized in many ways:
- Choose from a variety of graph types; line, bar, mixed line and bar, scatter plot and scatter plot matrix.
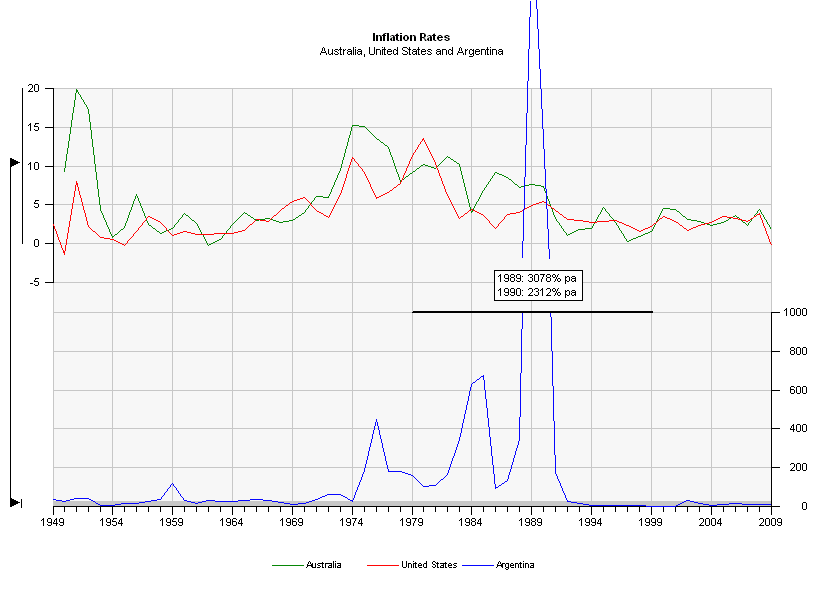
- Assign series to left or right axes, and arrange graphs in multiple panes.
- Edit axis titles and series legends as required.
- Customize line styles, line and bar colors and series markers.
- Select individual fonts for the various graph components.
- Customize axis scales, tic marks, gridlines and colors.
- Control the exact format of dates displayed on the time axis.
- Annotate graphs with lines, arrows, boxes and captions.
- Add recession bands.
Once you have a graph customized to your liking, you can then save it as a graph template which can then be applied to other graphs you create.